Computational & Data Journalism @ Cardiff

Reporting. Building. Designing. Informing

  • Blog
  • About Us
  • Local
  • Guests
You are here: Home / Archives for foi

Scraping the Assembly

2nd November 2016 by Martin Chorley

Glyn is currently teaching the first-semester module on Data Journalism. As part of this, students need to complete a data investigation project. One of the students is looking at the expenses of Welsh Assembly Members. These are all freely available online, but not in an easy to manipulate form. According to the Assembly they’d be happy to give the data out as a spreadsheet, if we submitted an FOI.

To me, this seems quite stupid. The information is all online and freely accessible. You’ve admitted you’re willing to give it out to anyone who submits an FOI. So why not just make the raw data available to download? This does not sound like a helpful Open Government to me. Anyway, for whatever reason, they’ve chosen not to, and we can’t be bothered to wait around for an FOI to come back. It’s much quicker and easier to build a scraper! We’ll just use selenium to drive a web browser, submit a search, page through all the results collecting the details, then dump it all out to csv. Simple.

Scraping the Assembly

I built this as a quick hack this morning. It took about an hour or so, and it shows. The code is not robust in any way, but it works. You can ask it for data from any year (or a number of years) and it’ll happily sit there churning its way through the results and spitting them out as both .csv and .json.

All the code is available on Github and it’s under an MIT Licence. Have fun 😉

Filed Under: Blog, Teaching Tagged With: coding, data, foi, investigation, oss, python, scraping

Empty Properties: simple choropleth maps with leaflet.js

27th November 2015 by Martin Chorley

We’re still working on looking at empty properties around Wales, and so while we wait for the FOI request results to come in, I thought it would be interesting to do a bit of basic mapping. Normally, if I want to create a choropleth I reach straight for d3 and my collection of topojson, but we’re still very early in the course, and we haven’t covered d3 yet (we go into it in some detail in next semester’s visualisation course). As we haven’t covered d3 yet, we need a simple solution, and fortunately the leaflet API makes it very easy to draw polygons on top of a map; all we need to know are the coordinates of the shape that we want to draw.

So, first we need to grab boundary files for the parishes around Wales. A quick hunt through the bafflingly obtuse ONS geoportal brings us to the generalised parish boundaries (E+W). Although it doesn’t seem immediately obvious from that page, there is a download link there that allows us to obtain shapefiles containing the boundary data for every parish in England and Wales. Unfortunately, these files are in a rather complicated shapefile format, when all we really need is a list of coordinates that we can throw into some JavaScript. We could extract and transform this data using command line tools, but as this is an early demo, we’ll use some graphical tools to do the work. So, first of all we open up the shapefile in our favourite GIS software:

England + Wales Parish boundaries in QGIS

England + Wales Parish boundaries in QGIS

This is all the parishes for England and Wales, and we only want the boundaries for Wales, so the next thing we’ll do is extract those. Looking at the attribute table, we see that each parish has a code connecting it to it’s Local Authority District (the LAD14CD). Using a simple filter on the ‘LAD14CD’, we can extract all those parishes that are in a local authority district in Wales, by selecting only those LAD14CDs that begin with a ‘W’:

Filtering based on attributes - substr(LAD14CD, 0, 2) = 'W'

Filtering based on attributes

This gives us our Welsh parishes:

Welsh parishes selected

Welsh parishes selected

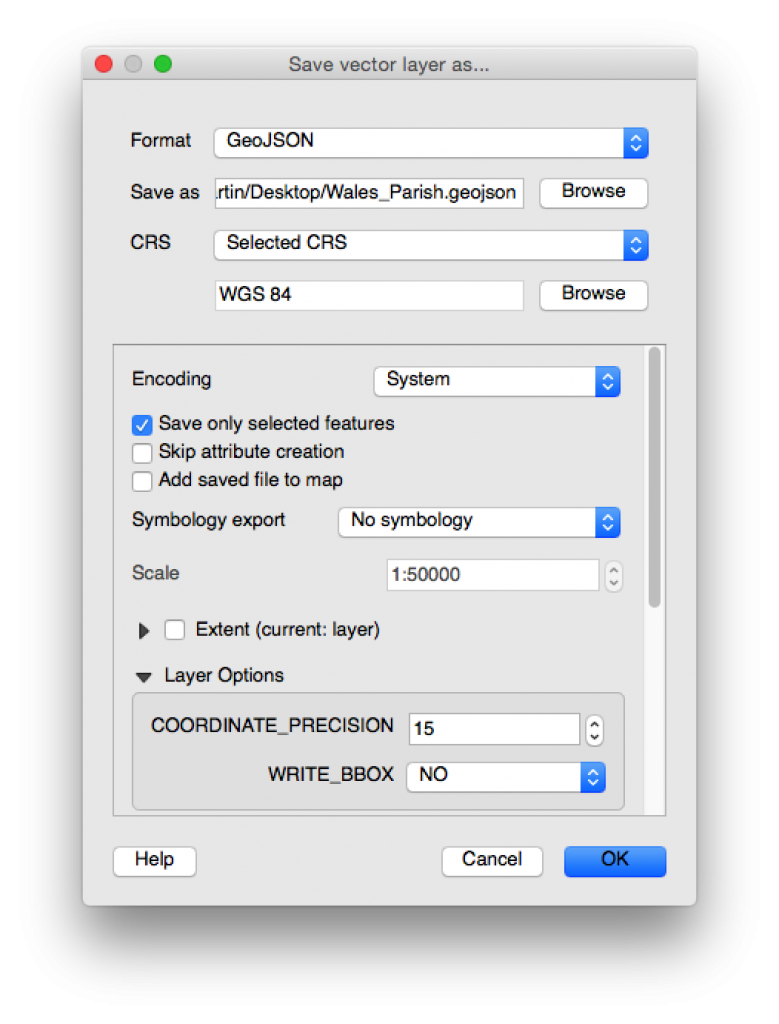
Now we can save this selection as geoJSON, which is a nicer format to work with than ESRI shapefiles, and will easily be handled by Leaflet. While we’re at it, we can convert the coordinates of the boundary data to WGS84 (which essentially gives us Lat,Lng coordinates we can use with our map):

Saving the selected parishes

Saving the selected parishes

For this example (because we’ve only had a response from Cardiff Council so far), we only need to deal with the Cardiff parishes, so for simplicity we’ll extract the Cardiff parishes from our large geoJSON file into a smaller Cardiff specific file. A quick bit of Python looking for all the parishes with a LAD14CD of ‘W06000015’ is all that’s needed here:

import json

parishes = json.load(open('Wales_Parish.geojson', 'r'))
cardiff_parishes = {'type': parishes['type'], 'crs': parishes['crs'], 'features': []}

for feature in parishes['features']:
 if feature['properties']['LAD14CD'] == 'W06000015':
 cardiff_parishes['features'].append(feature)

json.dump(cardiff_parishes, open('Cardiff_Parish.geojson', 'w'))

This geojson is all we need to display the parish boundaries on our map. In fact, if we edit the geojson file to include

var parishes = {ALL_OUR_GEOJSON_DATA}

We can import this directly into a webpage and load it into a map with leaflet relatively easily using the geoJson function in leaflet:

<!DOCTYPE html>
<html lang="en">
<head>
 <meta charset="UTF-8">
 <meta name="viewport" content="width=device-width, initial-scale=1.0, maximum-scale=1.0, user-scalable=no" />
 
 <title>Empty Properties</title>
 <link rel="stylesheet" href="http://cdn.leafletjs.com/leaflet/v0.7.7/leaflet.css" />
 
 <style>
 html, body, #map {
     height: 100%;
     width: 100%;
 }
 </style>
</head>
<body>
 <div id="map"></div>

 <script src="http://cdn.leafletjs.com/leaflet/v0.7.7/leaflet.js"></script>
 <script src="cardiff_parish.js"></script>
 <script>
   // create map and centre on Cardiff
   var map = L.map('map').setView([51.455, -3.19], 12);

   L.geoJson(parishes).addTo(map);

   // add some mapbox tiles
   var tileLayer = L.tileLayer('http://{s}.tiles.mapbox.com/v3/' + 'YOUR_MAPBOX_API_KEY' + '/{z}/{x}/{y}.png', { 
       attribution: 'Map data &copy; <a href="http://openstreetmap.org">OpenStreetMap</a> contributors, <a href="http://creativecommons.org/licenses/by-sa/2.0/">CC-BY-SA</a>, Imagery © <a href="http://mapbox.com">Mapbox</a>',
       maxZoom: 18
   }).addTo(map);
 </script>
</body>
</html>

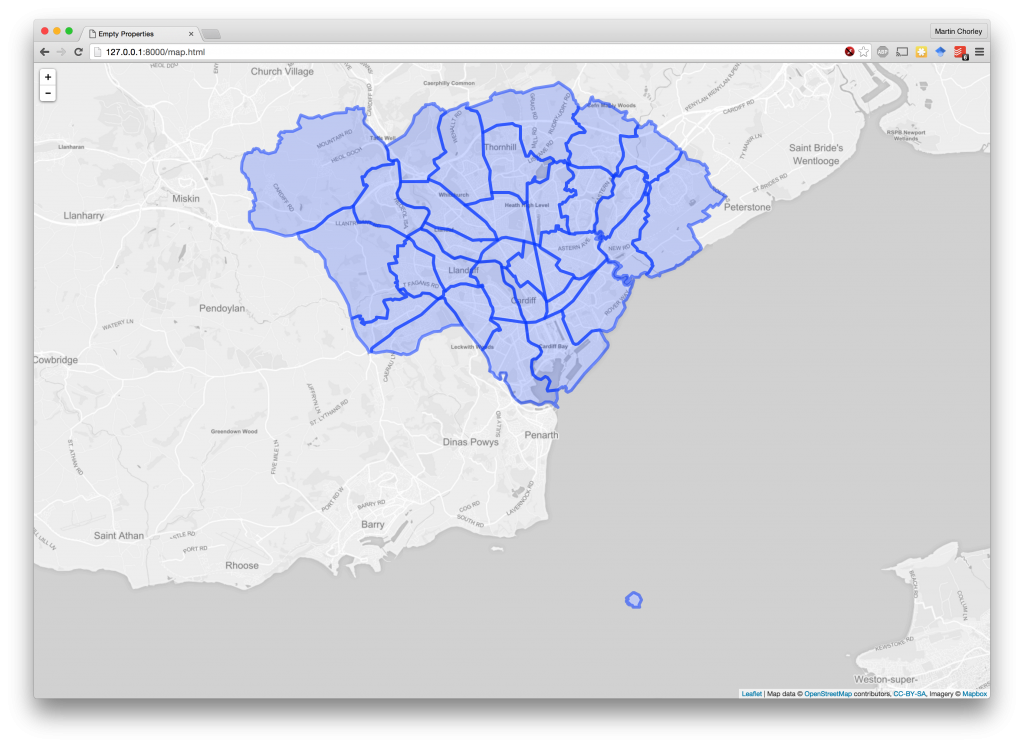
This gives us a nice map of Cardiff with the parish boundaries:

Cardiff parishes on a map

Cardiff parishes on a map

All we need to do now is alter the colour of our parishes based on the number of empty properties within that parish. So, we go back to the data we extracted preciously, which gave us the total number of empty properties in each parish. We can go back to our code that extracts the Cardiff parishes from the large geojson file, and this time whenever we extract a Cardiff parish, we add a property to the geoJson feature with its value from the empty properties data. We also add min and max values across the whole set of parishes:

import json
import pandas

parishes = json.load(open('Wales_Parish.geojson', 'r'))
cardiff_parishes = {'type': parishes['type'], 'crs': parishes['crs'], 'features': [], 'properties':{}}

parish_totals = pandas.read_csv('parish_totals.csv', index_col=0)

cardiff_parishes['properties']['min'] = parish_totals['value'].min()
cardiff_parishes['properties']['max'] = parish_totals['value'].max()

for feature in parishes['features']:
 if feature['properties']['LAD14CD'] == 'W06000015':
 
 parish_name = feature['properties']['PARNCP14NM'].strip().upper()
 feature['properties']['empty_total'] = parish_totals.loc[parish_name]['value']

 cardiff_parishes['features'].append(feature)
 
json.dump(cardiff_parishes, open('Cardiff_Parish.geojson', 'w'))

Then, we set up a colour scale in our JavaScript code for creating the map (based off a single-hue colorbrewer scale), and style each shape according to its value by adding a style function that gets called by Leaflet when it is drawing each geoJson feature:

<script>
 // create map and centre on Cardiff
 var map = L.map('map').setView([51.455, -3.19], 12);

 var divisor = parishes.properties.max / 9;
 var colour_scale = ["#fff7ec", "#fee8c8", "#fdd49e", "#fdbb84", "#fc8d59", "#ef6548", "#d7301f", "#b30000", "#7f0000"];

 L.geoJson(parishes, {
   style: function(feature){
     var colour = colour_scale[Math.round((feature.properties.empty_total/divisor)-1)];
     return {color: colour, fillOpacity: 0.4, weight: 2}
   }
 }).addTo(map);

 // add some mapbox tiles
 var tileLayer = L.tileLayer('http://{s}.tiles.mapbox.com/v3/' + 'YOUR_MAPBOX_API_KEY' + '/{z}/{x}/{y}.png', { attribution: 'Map data &copy; <a href="http://openstreetmap.org">OpenStreetMap</a> contributors, <a href="http://creativecommons.org/licenses/by-sa/2.0/">CC-BY-SA</a>, Imagery © <a href="http://mapbox.com">Mapbox</a>', maxZoom: 18 }).addTo(map); </script>

And with a refresh of our map page, there we have a choropleth of the parishes in Cardiff, coloured by the number of empty properties:

Choropleth of empty properties in Cardiff

Choropleth of empty properties in Cardiff

This is a nice quick example that has allowed us to begin thinking about mapping data, and some of the issues surrounding such mappings, before we begin to study them it in detail next semester. As more of the data is returned from our FOI requests, we can start expanding this visualisation across Wales.

Filed Under: Blog, Teaching, The Lab Tagged With: choropleth, coding, foi, leaflet.js, map, visualisation

Visualising data – first try to get the information #foia

10th November 2015 by Glyn Mottershead

Derelict House © Copyright David Wright and licensed for reuse under this Creative Commons Licence

© Copyright David Wright and licensed for reuse under this Creative Commons Licence

We’re currently looking at how many empty properties there are across Wales.

The students and staff are in the process of using the Freedom of Information act to get data sets as part of our sessions around data journalism and visualising data.

(Martin recently did a post looking at different technologies for wrangling the data from the first request).

We’ve applied to all 22 of the Welsh councils for the same information and are starting to get responses before the 20 day statutory limit.

And it is really interesting to see how that request is being interpreted by different councils.

So, to explain that we’ll go back to our first application – Cardiff

What do they know?

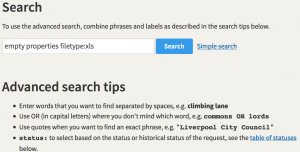
Advanced search on What Do They Now FOI site

Advanced search on What Do They Now FOI site

To keep the application and responses in public, our preferred way of working is to make the  application on What Do They Know.

This is a great resource for anyone intersted in public data, and has an advanced search facility that really helps you find what you are looking for as it uses a syntax familiar to anyone who has used the advanced Google Search techniques.

We asked for:

1 The number of
2 address (including street number and postcode) of homes that:

a) have been empty for over 6 months
b) have been empty for under 6 months
c) your empty homes strategy including what empty homes (if any)
you prioritise.

And we got it, the only issue was we got PDF but asked for Excel. Tabula is a great tool for dealing with information locked in PDF format but we just asked for the new filetype and got them.

The rest of Wales

We then applied to the other 21 authorities in Wales, and have had widely varying results.

We’d already picked up that there might be some issues, given the phrasing coming back from Cardiff, so we made sure that later applications acknowledged (and hopefully dealt with) the anticipated exceptions.

And we hit one in particular so far. Section 31(a) – crime.

Section 31(1)(a) the prevention or detection of crime

  1. Section 31(1)(a) will cover all aspects of the prevention and detection of crime. It could apply to information on general policies and methods adopted by law enforcement agencies. For example, the police’s procedures for collecting forensic evidence, Her Majesty’s Revenue and Customs procedures for investigating tax evasion.
  2. The exemption also covers information held by public authorities without any specific law enforcement responsibilities. It could be used by a public authority to withhold copies of information it had provided to a law enforcement agency as part of an investigation. It could also be used to withhold information that would make anyone, including the public authority itself, more vulnerable to crime for example, by disclosing its own security procedures, such as alarm codes.
  3. Whilst in some instances information held for the purposes of preventing or detecting crime will be exempt, it does not have to be held for such purposes for its disclosure to be prejudicial.

There is a public interest test to this exemption, so we’re off to read up on the Information Commissioner’s rulings on this as we’ve already had a few knock backs.

I will come back to the post, and the applications, when we’ve got all the responses we asked for.

Filed Under: Blog, Teaching, The Lab Tagged With: foi, FOIA, investigation

Updating Empty Properties: Agate vs Pandas

5th November 2015 by Martin Chorley

In the lab session this week we looked again at the Freedom of Information act and considered a request to Cardiff Council for the list of empty properties in Cardiff. Last year we did a very similar session, but this year I carried out the simple data analysis slightly differently.

[Read more…]

Filed Under: Blog, Teaching, The Lab Tagged With: agate, coding, data, foi, pandas, python, tools

Empty Properties & Postcodes

5th January 2015 by Martin Chorley

As part of the course we hold a weekly session where we try and tie together Journalism and Computer Science: “The Lab”. One of the first sessions we held looked at the results of a Freedom of Information request – tying together a commonly used journalistic tool with some simple coding and data analysis.

Glyn had submitted a Freedom of Information request to Cardiff Council asking for the number of empty properties across the city. This was partially successful, as it turns out the information was already published on the Council website. Unfortunately, as is common with many council documents, the data was made available as a .pdf file. This is a terrible way to have to receive data, as .pdf files are not easily machine readable. So, our first task was to extract the data. (It’s interesting to note that the latest version of this data has been released as an .xls file. It’s still not a fully REST compliant API spitting out lovely well formed JSON, but it’s a step in the right direction at least).

There are many excellent tools for extracting data from .pdf files, such as Tabula for instance. However, often the simplest solutions are the best, and in this case it was completely possible to just copy and paste the contents of the .pdf into a spreadsheet. Once the data was in the spreadsheet we could save it as a Comma Separated Value (.csv) file, which is a fairly simple format to deal with using some python code.

We now have a .csv file listing the postcode and parish of every empty property in Cardiff, along with the date when the property became unoccupied. It is therefore pretty easy to do some simple analysis of the data using Python. For example, we can count the number of occurrences of each parish name, and find the ten areas of Cardiff with the most empty properties:

import csv
from collections import defaultdict

inputfile = open('emptyproperties.csv', 'rU')
csv_reader = csv.DictReader(inputfile)

parish_count = defaultdict(int)

for row in csv_reader:
  parish = row['Parish']
  parish_count[parish] += 1

sorted_parishes = sorted(parish_count.items(), key=operator.itemgetter(1), reverse=True)
print(sorted_parishes[0:10])

Screenshot 2014-12-04 14.40.53


Part of creating a story around this result would be to add context to this data. Anyone with local knowledge will recognise that Butetown (including Cardiff Bay) has many blocks of rental flats, which probably explains why there are so many empty properties there. Whitchurch however is a fairly affluent middle class area, so its presence in the top ten is surprising and may require further investigation.

We can also use the dates within the data to find the postcode of the property that has been empty longest:

import csv
import datetime

inputfile = open('emptyproperties_correct.csv', 'rU')
csv_reader = csv.DictReader(inputfile)

earliest_date = datetime.datetime.now()
earliest_postcode = ''

for row in csv_reader:
 date = row['Occupancy Period Start Date ']

 if date is not '':
   py_date = datetime.datetime.strptime(date, "%d-%b-%y")

   if py_date < earliest_date:
     earliest_date = py_date
     earliest_postcode = row['Post Code ']

print earliest_postcode, earliest_date

Screenshot 2014-12-04 14.44.21


According to the data, a property in central Cardiff, near to HMP Cardiff, has been empty since 1993. Clearly, further investigation is required to find out whether the data is accurate, and if so, why the property has been empty so long.

These short little examples show how you can start to use simple bits of code to dive into and analyse data quickly, to find the interesting features hidden in the data, that with some investigation may lead on to an interesting story. In future sessions, we can go on to look at interesting ways to visualise this data and examine it further.

Filed Under: Blog, The Lab Tagged With: coding, foi, python, tools

Copyright © 2023 · News Pro Theme on Genesis Framework · WordPress · Log in