As part of the course we hold a weekly session where we try and tie together Journalism and Computer Science: “The Lab”. One of the first sessions we held looked at the results of a Freedom of Information request – tying together a commonly used journalistic tool with some simple coding and data analysis.
Glyn had submitted a Freedom of Information request to Cardiff Council asking for the number of empty properties across the city. This was partially successful, as it turns out the information was already published on the Council website. Unfortunately, as is common with many council documents, the data was made available as a .pdf file. This is a terrible way to have to receive data, as .pdf files are not easily machine readable. So, our first task was to extract the data. (It’s interesting to note that the latest version of this data has been released as an .xls file. It’s still not a fully REST compliant API spitting out lovely well formed JSON, but it’s a step in the right direction at least).
There are many excellent tools for extracting data from .pdf files, such as Tabula for instance. However, often the simplest solutions are the best, and in this case it was completely possible to just copy and paste the contents of the .pdf into a spreadsheet. Once the data was in the spreadsheet we could save it as a Comma Separated Value (.csv) file, which is a fairly simple format to deal with using some python code.
We now have a .csv file listing the postcode and parish of every empty property in Cardiff, along with the date when the property became unoccupied. It is therefore pretty easy to do some simple analysis of the data using Python. For example, we can count the number of occurrences of each parish name, and find the ten areas of Cardiff with the most empty properties:
import csv
from collections import defaultdict

inputfile = open('emptyproperties.csv', 'rU')
csv_reader = csv.DictReader(inputfile)

parish_count = defaultdict(int)

for row in csv_reader:
  parish = row['Parish']
  parish_count[parish] += 1

sorted_parishes = sorted(parish_count.items(), key=operator.itemgetter(1), reverse=True)
print(sorted_parishes[0:10])

Part of creating a story around this result would be to add context to this data. Anyone with local knowledge will recognise that Butetown (including Cardiff Bay) has many blocks of rental flats, which probably explains why there are so many empty properties there. Whitchurch however is a fairly affluent middle class area, so its presence in the top ten is surprising and may require further investigation.
We can also use the dates within the data to find the postcode of the property that has been empty longest:
import csv
import datetime

inputfile = open('emptyproperties_correct.csv', 'rU')
csv_reader = csv.DictReader(inputfile)

earliest_date = datetime.datetime.now()
earliest_postcode = ''

for row in csv_reader:
 date = row['Occupancy Period Start Date ']

 if date is not '':
   py_date = datetime.datetime.strptime(date, "%d-%b-%y")

   if py_date < earliest_date:
     earliest_date = py_date
     earliest_postcode = row['Post Code ']

print earliest_postcode, earliest_date
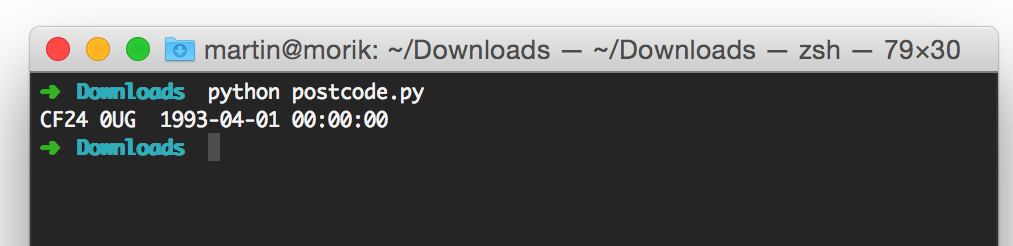
According to the data, a property in central Cardiff, near to HMP Cardiff, has been empty since 1993. Clearly, further investigation is required to find out whether the data is accurate, and if so, why the property has been empty so long.
These short little examples show how you can start to use simple bits of code to dive into and analyse data quickly, to find the interesting features hidden in the data, that with some investigation may lead on to an interesting story. In future sessions, we can go on to look at interesting ways to visualise this data and examine it further.
[…] thrown up a post on compj.cs.cf.ac.uk about some work we’ve done looking at empty properties in Cardiff. […]